22
Mar 2019
 admin
admin
 0 Comments
New paper in Progress in Oceanography
Satellites have clearly demonstrated the worth in mapping the ocean’s temperature, wave height, and plankton productivity, but we have not learned how to map the ocean’s rates of nitrogen-based productivity, respiratory CO2 production, oxygen consumption, and many other important ocean rate processes. Our recently published paper on modeling New Production from nitrate reductase activity is a “first-step” in learning how to map nitrate-based primary productivity over time and in ocean-space. We used measurements of the phytoplankton, intracellular-enzyme, nitrate reductase; measurements of light in the ocean surface waters; and enzyme-kinetics to calculate the New Production in the illuminated near-surface waters along a transect across the Peru Current upwelling system (Figure 1). Ocean primary productivity by the phytoplankton (marine micro-algae) is comprised of New Production and Regenerated Production. The New Production is based on nitrate upwelled from the deep-dark ocean; the Regenerated Production is based on ammonium from the animals, big and small, swimming and living in the seawater. Here, we have calculated the New Production at 15° S. The calculation is based on unique measurements from the Coastal Upwelling Ecosystem Analysis (CUEA) JASON expedition from September 1976. The New Production, at its maximum, ranged from 3.49 μM C h−1, near the upwelling center to 0.15 μM C h−1, 50 km further downstream over the 4000 m deep Peru Trench where the upwelling was relatively weak. It compared well with 14C-carbon gross productivity measurements whose range was 4.2 to 0 μM C h−1. In nitrogen units, the overall new production ranged from 510 to 4 nM of N h−1. The oceanographic conditions found during September 1976, made this upwelling site an ideal one to calculate new production. Temperature in the center of the upwelling in September of 1976 reached 14.07°C, while NO3-; ranged from 6.65 to 7.5μM, and NH4+ stayed below 0.1μM. Chlorophyll, averaging 3.85 μg L−1 for the section in September 1976, was similar to what it was for the same section 6 months later in March 1977 (3.23 μg L−1). The nitrate reductase activity, averaging 0.20 μM N h−1 for the section in September 1976, was twice what it was on the section, 6 month later in March 1977 (0.09 μM N h−1). In a future paper, we will calculate the New Production for the 1977 section.
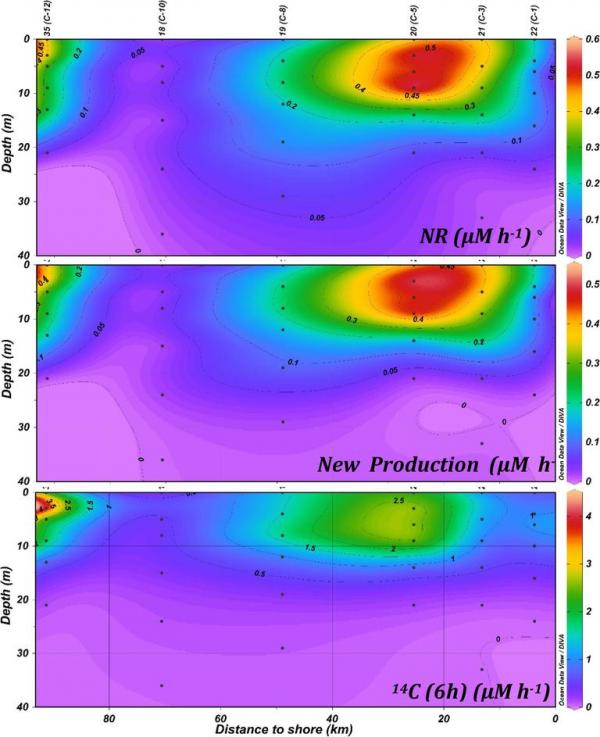
Figure. 1. Distribution of the Nitrate-Reductase activity expressed in microM of N, New production, calculated in terms of Nitrogen and 14C productivity calculated from 6h deck-incubated bottled phytoplankton, along the C-Line from C-1 to C-12 in the upwelling system of Peru coast, from 16th to 22th September 1976.
Reference:
González-Galisteo, S. T. Packard, M. Gómez, A. Herrera, R.C. Dugdale, F.P. Wilkerson, R.T. Barber, D. Blasco, J.P. Christensen, L.A. Codispoti (2019). Calculating new production from nitrate reductase activity and light in the Peru current upwelling. Progress in Oceanography, 173:78-85
(Can found it in our Papers section; Free download until 20th april in this link: https://authors.elsevier.com/c/1YefVI7ECcMVC)


